Iron in PDB 3o1y: Electron Transfer Complexes: Experimental Mapping of the Redox- Dependent Cytochrome C Electrostatic Surface
Protein crystallography data
The structure of Electron Transfer Complexes: Experimental Mapping of the Redox- Dependent Cytochrome C Electrostatic Surface, PDB code: 3o1y
was solved by
M.De March,
R.De Zorzi,
N.Demitri,
C.Gabbiani,
A.Guerri,
A.Casini,
L.Messori,
S.Geremia,
with X-Ray Crystallography technique. A brief refinement statistics is given in the table below:
Resolution Low / High (Å)
|
69.01 /
1.75
|
Space group
|
P 31 2 1
|
Cell size a, b, c (Å), α, β, γ (°)
|
79.695,
79.695,
89.247,
90.00,
90.00,
120.00
|
R / Rfree (%)
|
18.6 /
24.8
|
Iron Binding Sites:
The binding sites of Iron atom in the Electron Transfer Complexes: Experimental Mapping of the Redox- Dependent Cytochrome C Electrostatic Surface
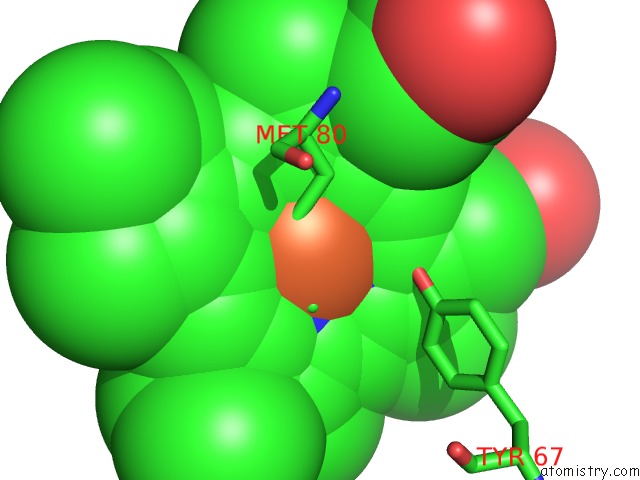
(pdb code 3o1y). This binding sites where shown within
5.0 Angstroms radius around Iron atom.
In total 3 binding sites of Iron where determined in the
Electron Transfer Complexes: Experimental Mapping of the Redox- Dependent Cytochrome C Electrostatic Surface, PDB code: 3o1y:
Jump to Iron binding site number:
1;
2;
3;
Iron binding site 1 out
of 3 in 3o1y
Go back to
Iron Binding Sites List in 3o1y
Iron binding site 1 out
of 3 in the Electron Transfer Complexes: Experimental Mapping of the Redox- Dependent Cytochrome C Electrostatic Surface
Mono view
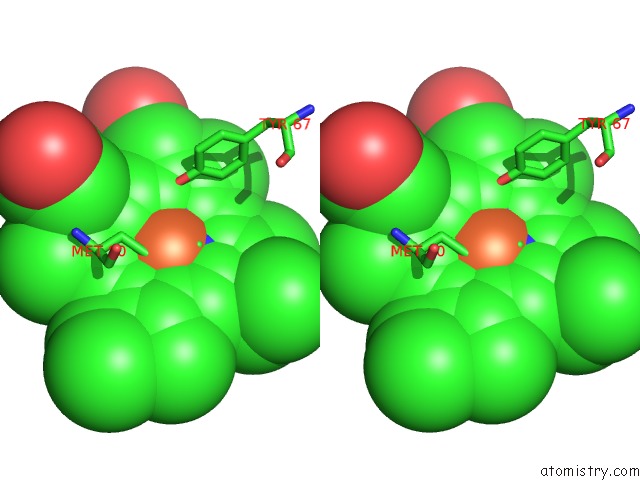
Stereo pair view
|
A full contact list of Iron with other atoms in the Fe binding
site number 1 of Electron Transfer Complexes: Experimental Mapping of the Redox- Dependent Cytochrome C Electrostatic Surface within 5.0Å range:
probe
|
atom
|
residue
|
distance (Å)
|
B
|
Occ
|
A:Fe105
b:12.2
occ:1.00
|
FE
|
A:HEC105
|
0.0
|
12.2
|
1.0
|
NE2
|
A:HIS18
|
2.0
|
10.3
|
1.0
|
ND
|
A:HEC105
|
2.0
|
8.1
|
1.0
|
NA
|
A:HEC105
|
2.0
|
9.2
|
1.0
|
NC
|
A:HEC105
|
2.1
|
10.2
|
1.0
|
NB
|
A:HEC105
|
2.1
|
7.3
|
1.0
|
SD
|
A:MET80
|
2.3
|
11.9
|
1.0
|
CE1
|
A:HIS18
|
2.9
|
10.2
|
1.0
|
C1D
|
A:HEC105
|
3.0
|
9.1
|
1.0
|
C4D
|
A:HEC105
|
3.0
|
11.2
|
1.0
|
C1A
|
A:HEC105
|
3.1
|
10.1
|
1.0
|
C4C
|
A:HEC105
|
3.1
|
9.0
|
1.0
|
C4B
|
A:HEC105
|
3.1
|
10.1
|
1.0
|
C1B
|
A:HEC105
|
3.1
|
9.9
|
1.0
|
CD2
|
A:HIS18
|
3.1
|
10.5
|
1.0
|
C1C
|
A:HEC105
|
3.1
|
9.8
|
1.0
|
C4A
|
A:HEC105
|
3.1
|
11.7
|
1.0
|
CHA
|
A:HEC105
|
3.4
|
9.5
|
1.0
|
CHD
|
A:HEC105
|
3.4
|
8.6
|
1.0
|
CG
|
A:MET80
|
3.4
|
8.5
|
1.0
|
CE
|
A:MET80
|
3.4
|
10.0
|
1.0
|
CHC
|
A:HEC105
|
3.5
|
10.0
|
1.0
|
CHB
|
A:HEC105
|
3.5
|
8.6
|
1.0
|
ND1
|
A:HIS18
|
4.1
|
11.8
|
1.0
|
CG
|
A:HIS18
|
4.2
|
9.2
|
1.0
|
C2D
|
A:HEC105
|
4.2
|
10.3
|
1.0
|
C3B
|
A:HEC105
|
4.3
|
8.6
|
1.0
|
C3D
|
A:HEC105
|
4.3
|
9.5
|
1.0
|
C2B
|
A:HEC105
|
4.3
|
9.0
|
1.0
|
C3C
|
A:HEC105
|
4.3
|
9.3
|
1.0
|
CB
|
A:MET80
|
4.3
|
10.1
|
1.0
|
C2C
|
A:HEC105
|
4.3
|
8.4
|
1.0
|
C2A
|
A:HEC105
|
4.3
|
11.1
|
1.0
|
C3A
|
A:HEC105
|
4.3
|
11.2
|
1.0
|
OH
|
A:TYR67
|
4.5
|
11.7
|
1.0
|
|
Iron binding site 2 out
of 3 in 3o1y
Go back to
Iron Binding Sites List in 3o1y
Iron binding site 2 out
of 3 in the Electron Transfer Complexes: Experimental Mapping of the Redox- Dependent Cytochrome C Electrostatic Surface
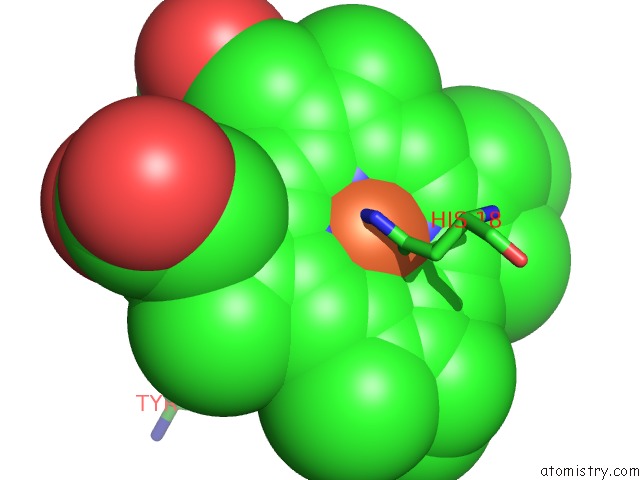
Mono view
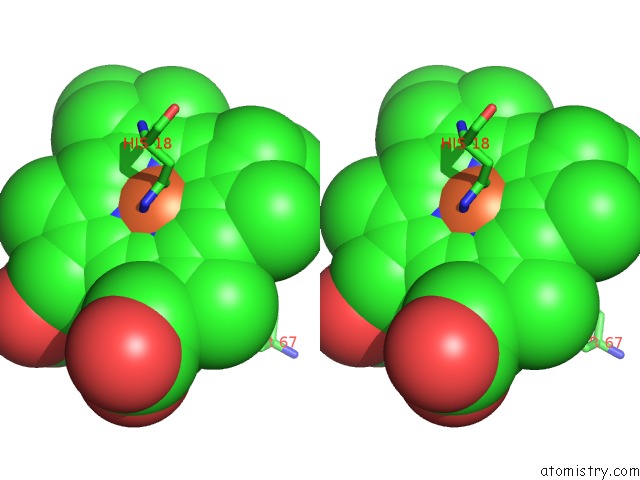
Stereo pair view
|
A full contact list of Iron with other atoms in the Fe binding
site number 2 of Electron Transfer Complexes: Experimental Mapping of the Redox- Dependent Cytochrome C Electrostatic Surface within 5.0Å range:
probe
|
atom
|
residue
|
distance (Å)
|
B
|
Occ
|
B:Fe105
b:12.3
occ:1.00
|
FE
|
B:HEC105
|
0.0
|
12.3
|
1.0
|
NE2
|
B:HIS18
|
2.0
|
11.2
|
1.0
|
NB
|
B:HEC105
|
2.0
|
9.7
|
1.0
|
NC
|
B:HEC105
|
2.1
|
10.8
|
1.0
|
NA
|
B:HEC105
|
2.1
|
8.6
|
1.0
|
ND
|
B:HEC105
|
2.1
|
10.9
|
1.0
|
SD
|
B:MET80
|
2.4
|
11.0
|
1.0
|
CE1
|
B:HIS18
|
2.9
|
9.2
|
1.0
|
C1B
|
B:HEC105
|
3.0
|
12.0
|
1.0
|
CD2
|
B:HIS18
|
3.0
|
9.8
|
1.0
|
C4B
|
B:HEC105
|
3.0
|
14.2
|
1.0
|
C4A
|
B:HEC105
|
3.0
|
13.8
|
1.0
|
C4C
|
B:HEC105
|
3.0
|
11.5
|
1.0
|
C1D
|
B:HEC105
|
3.1
|
12.4
|
1.0
|
C1A
|
B:HEC105
|
3.1
|
11.3
|
1.0
|
C4D
|
B:HEC105
|
3.1
|
12.8
|
1.0
|
C1C
|
B:HEC105
|
3.1
|
12.8
|
1.0
|
CHB
|
B:HEC105
|
3.4
|
10.6
|
1.0
|
CHD
|
B:HEC105
|
3.4
|
10.2
|
1.0
|
CE
|
B:MET80
|
3.4
|
9.9
|
1.0
|
CHA
|
B:HEC105
|
3.4
|
10.0
|
1.0
|
CHC
|
B:HEC105
|
3.5
|
11.1
|
1.0
|
CG
|
B:MET80
|
3.5
|
8.8
|
1.0
|
ND1
|
B:HIS18
|
4.0
|
11.6
|
1.0
|
CG
|
B:HIS18
|
4.1
|
9.6
|
1.0
|
C2B
|
B:HEC105
|
4.2
|
11.0
|
1.0
|
C3B
|
B:HEC105
|
4.2
|
11.0
|
1.0
|
C3A
|
B:HEC105
|
4.3
|
7.9
|
1.0
|
C3C
|
B:HEC105
|
4.3
|
9.6
|
1.0
|
CB
|
B:MET80
|
4.3
|
9.9
|
1.0
|
C2D
|
B:HEC105
|
4.3
|
11.6
|
1.0
|
C2A
|
B:HEC105
|
4.3
|
11.0
|
1.0
|
C3D
|
B:HEC105
|
4.3
|
9.3
|
1.0
|
C2C
|
B:HEC105
|
4.3
|
9.5
|
1.0
|
OH
|
B:TYR67
|
4.5
|
13.1
|
1.0
|
|
Iron binding site 3 out
of 3 in 3o1y
Go back to
Iron Binding Sites List in 3o1y
Iron binding site 3 out
of 3 in the Electron Transfer Complexes: Experimental Mapping of the Redox- Dependent Cytochrome C Electrostatic Surface
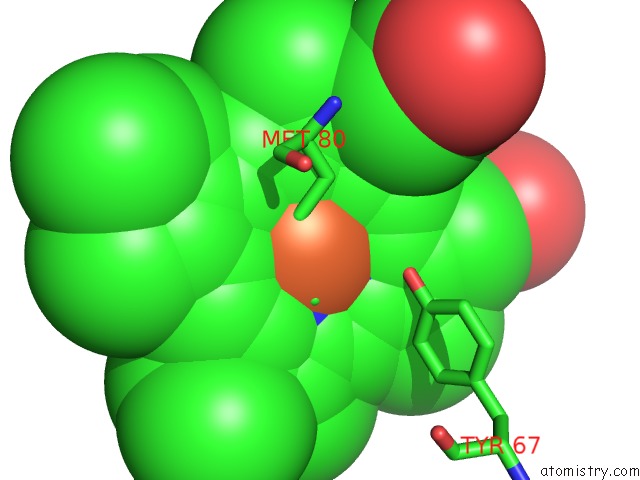
Mono view
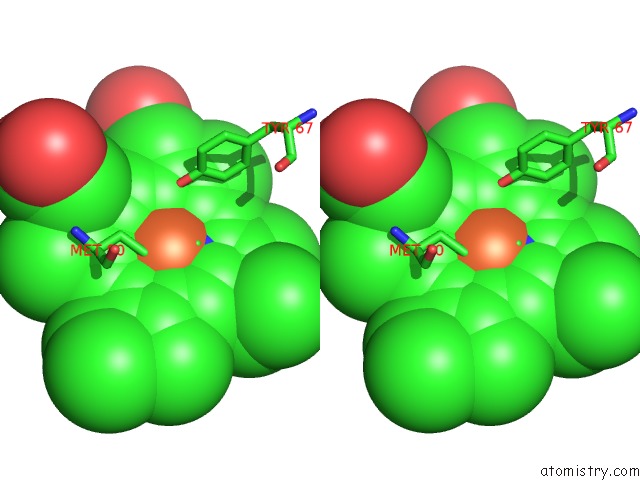
Stereo pair view
|
A full contact list of Iron with other atoms in the Fe binding
site number 3 of Electron Transfer Complexes: Experimental Mapping of the Redox- Dependent Cytochrome C Electrostatic Surface within 5.0Å range:
probe
|
atom
|
residue
|
distance (Å)
|
B
|
Occ
|
C:Fe105
b:11.1
occ:1.00
|
FE
|
C:HEC105
|
0.0
|
11.1
|
1.0
|
NE2
|
C:HIS18
|
2.0
|
11.2
|
1.0
|
NB
|
C:HEC105
|
2.0
|
8.9
|
1.0
|
NC
|
C:HEC105
|
2.1
|
9.0
|
1.0
|
ND
|
C:HEC105
|
2.1
|
10.1
|
1.0
|
NA
|
C:HEC105
|
2.1
|
10.7
|
1.0
|
SD
|
C:MET80
|
2.3
|
10.8
|
1.0
|
CE1
|
C:HIS18
|
2.9
|
8.5
|
1.0
|
C1B
|
C:HEC105
|
3.0
|
7.8
|
1.0
|
C4B
|
C:HEC105
|
3.0
|
8.4
|
1.0
|
CD2
|
C:HIS18
|
3.0
|
9.5
|
1.0
|
C4A
|
C:HEC105
|
3.0
|
11.6
|
1.0
|
C1D
|
C:HEC105
|
3.0
|
11.1
|
1.0
|
C1C
|
C:HEC105
|
3.1
|
11.0
|
1.0
|
C4C
|
C:HEC105
|
3.1
|
9.1
|
1.0
|
C1A
|
C:HEC105
|
3.1
|
9.5
|
1.0
|
C4D
|
C:HEC105
|
3.1
|
10.9
|
1.0
|
CHB
|
C:HEC105
|
3.4
|
10.3
|
1.0
|
CE
|
C:MET80
|
3.4
|
10.7
|
1.0
|
CHC
|
C:HEC105
|
3.4
|
10.7
|
1.0
|
CHD
|
C:HEC105
|
3.4
|
8.1
|
1.0
|
CG
|
C:MET80
|
3.5
|
9.9
|
1.0
|
CHA
|
C:HEC105
|
3.5
|
9.7
|
1.0
|
ND1
|
C:HIS18
|
4.0
|
11.4
|
1.0
|
CG
|
C:HIS18
|
4.1
|
9.7
|
1.0
|
C3B
|
C:HEC105
|
4.2
|
10.6
|
1.0
|
C2B
|
C:HEC105
|
4.2
|
10.8
|
1.0
|
C3A
|
C:HEC105
|
4.3
|
8.7
|
1.0
|
C2D
|
C:HEC105
|
4.3
|
9.3
|
1.0
|
C3C
|
C:HEC105
|
4.3
|
8.9
|
1.0
|
C2C
|
C:HEC105
|
4.3
|
8.6
|
1.0
|
C2A
|
C:HEC105
|
4.3
|
10.0
|
1.0
|
CB
|
C:MET80
|
4.3
|
10.0
|
1.0
|
C3D
|
C:HEC105
|
4.3
|
11.1
|
1.0
|
OH
|
C:TYR67
|
4.5
|
11.5
|
1.0
|
|
Reference:
M.De March,
N.Demitri,
R.De Zorzi,
A.Casini,
C.Gabbiani,
A.Guerri,
L.Messori,
S.Geremia.
Nitrate As A Probe of Cytochrome C Surface: Crystallographic Identification of Crucial "Hot Spots" For Protein-Protein Recognition. J. Inorg. Biochem. V. 135 58 2014.
ISSN: ISSN 1873-3344
PubMed: 24662464
DOI: 10.1016/J.JINORGBIO.2014.02.015
Page generated: Sun Aug 4 16:56:14 2024
|